Coronavirus figures for Falmouth and Penryn
By Joseph Macey 16th Sep 2021


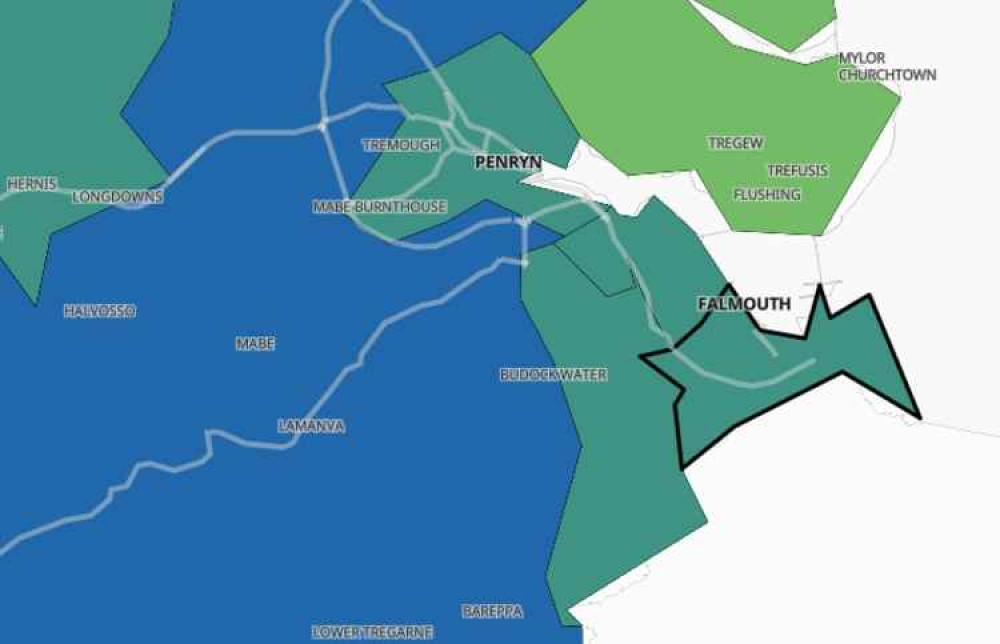
Falmouth and Penryn residents can now easily see how many Coronavirus cases there are in the area.
A government interactive map has been launched which is accessible to everyone.
The map uses official data to show the extent of Covid-19 in every area of the country within the past seven days. It is updated with new figures every day.
It shows:
- The number of cases in the past seven days (seven–day rolling rate of new cases by specimen date ending on 23rd December)
- The rate of infection per 100,000 people in the population
- How the area compares to the rest of England
Coronavirus in Falmouth
Falmouth North: 6 cases
Mylor Bridge and Flushing: 3 casesPenryn: 6 cases
Falmouth West and South: 8 casesFalmouth East: 5 cases
Ponsanooth, Mabe and Constantine: 14 cases (Zoom in on the map and you can see the road names.) Level rates are suppressed where there have been fewer than 3 cases in a seven-day period. This is to protect the privacy of individuals. This gov.uk interactive map has a high reference point of 400 cases per 100,000 – an illustration of how the virus is spreading across the country. You can view the interactive map for yourself here. [H3] Don't forget, you can see all the latest news and join in on the conversation on our Twitter and Facebook pages. [.H2]
CHECK OUT OUR Jobs Section HERE!
falmouth vacancies updated hourly!
Click here to see more: falmouth jobs
Share:


